Exhibition at The
British Library
20
February – 26 May 2014
The Folio Society Gallery; admission free
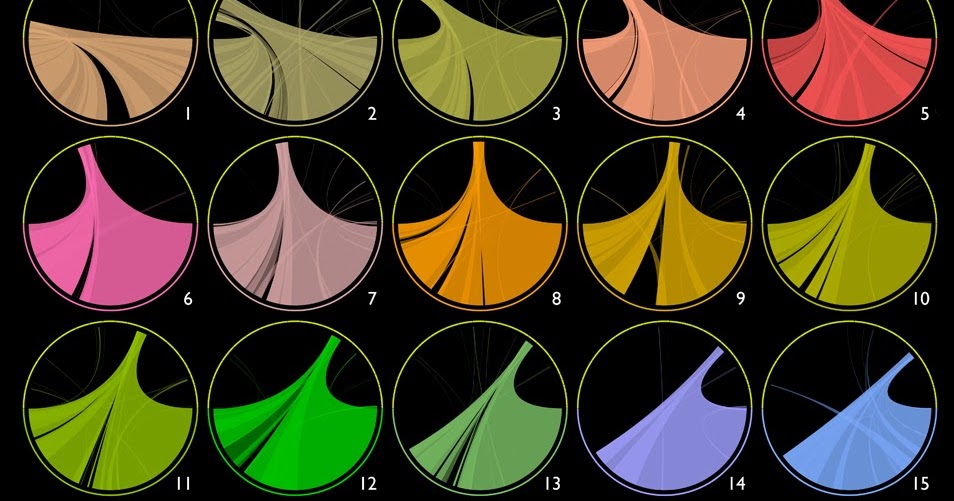
Turning numbers into pictures that tell
important stories and reveal the meaning held within is an essential part of
what it means to be a scientist. Beautiful Science explores how our
understanding of ourselves and our planet has evolved alongside our ability to
represent, graph and map the mass data of the time.
The associated events for the exhibition are listed here
Unfortunately this event….
Andy Kirk, founder of Visualising
Data will be holding his renowned Introduction to Data Visualisation
course at the British Library to coincide with Beautiful Science: Picturing
Data, Inspiring Insight.
…is sold out but fear not you can get
to see what Andy is about by looking at his website
Students who came to my Visual Literacy workshop
last term will already know about the King of Data visualisation Hans Rosling Professor of Global Health, Karolinska Institutet. Edutainer
& co-founder of Gapminder Foundation, Stockholm,
Sweden · gapminder.org
Meanwhile
as with everything and especially anything that is immensely visually attractive
-beware of being misled!! Here is a warning article about taking care to
question the veracity of infographics from John Burn-Murdoch of the Guardian
British Library
February – 26 May 2014
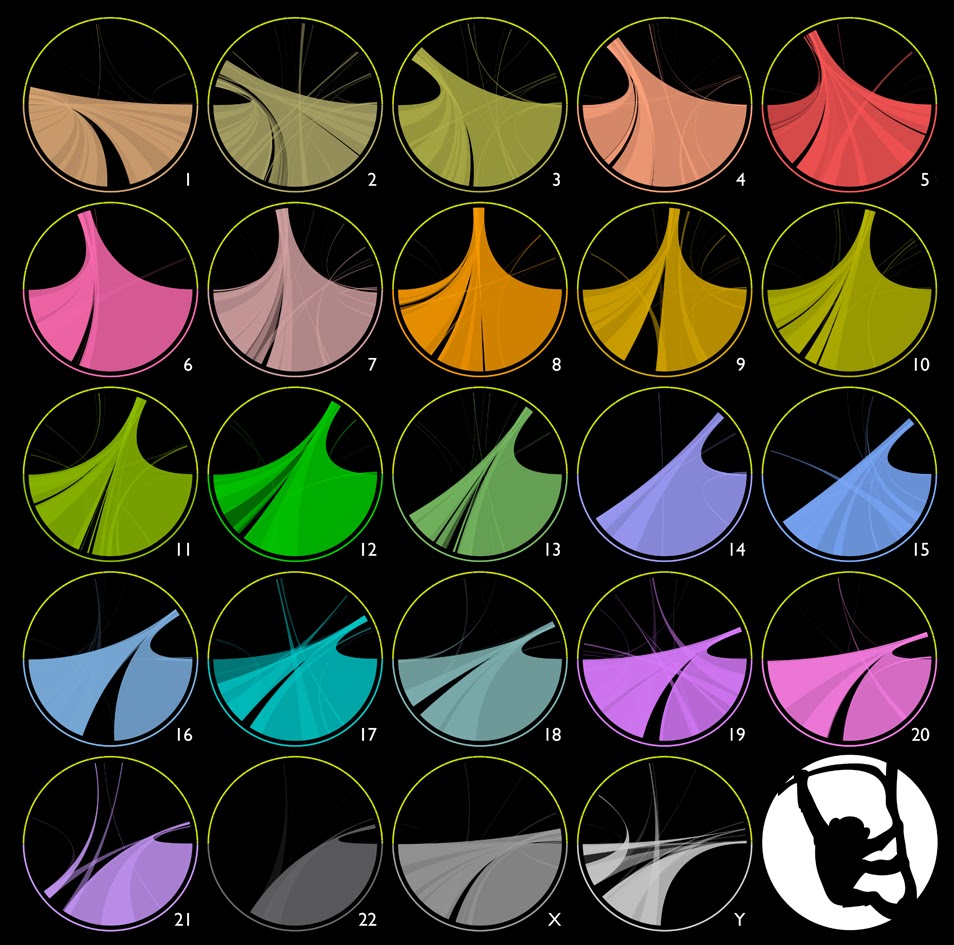
important stories and reveal the meaning held within is an essential part of
what it means to be a scientist. Beautiful Science explores how our
understanding of ourselves and our planet has evolved alongside our ability to
represent, graph and map the mass data of the time.
Data will be holding his renowned Introduction to Data Visualisation
course at the British Library to coincide with Beautiful Science: Picturing
Data, Inspiring Insight.
to see what Andy is about by looking at his website
last term will already know about the King of Data visualisation Hans Rosling Professor of Global Health, Karolinska Institutet. Edutainer
& co-founder of Gapminder Foundation, Stockholm,
Sweden · gapminder.org
as with everything and especially anything that is immensely visually attractive
-beware of being misled!! Here is a warning article about taking care to
question the veracity of infographics from John Burn-Murdoch of the Guardian